 easywall
GitHub ↗
easywall
GitHub ↗
Dashboard
The landing page after signing in. It answers one question before any other: is the firewall doing what you think it is?
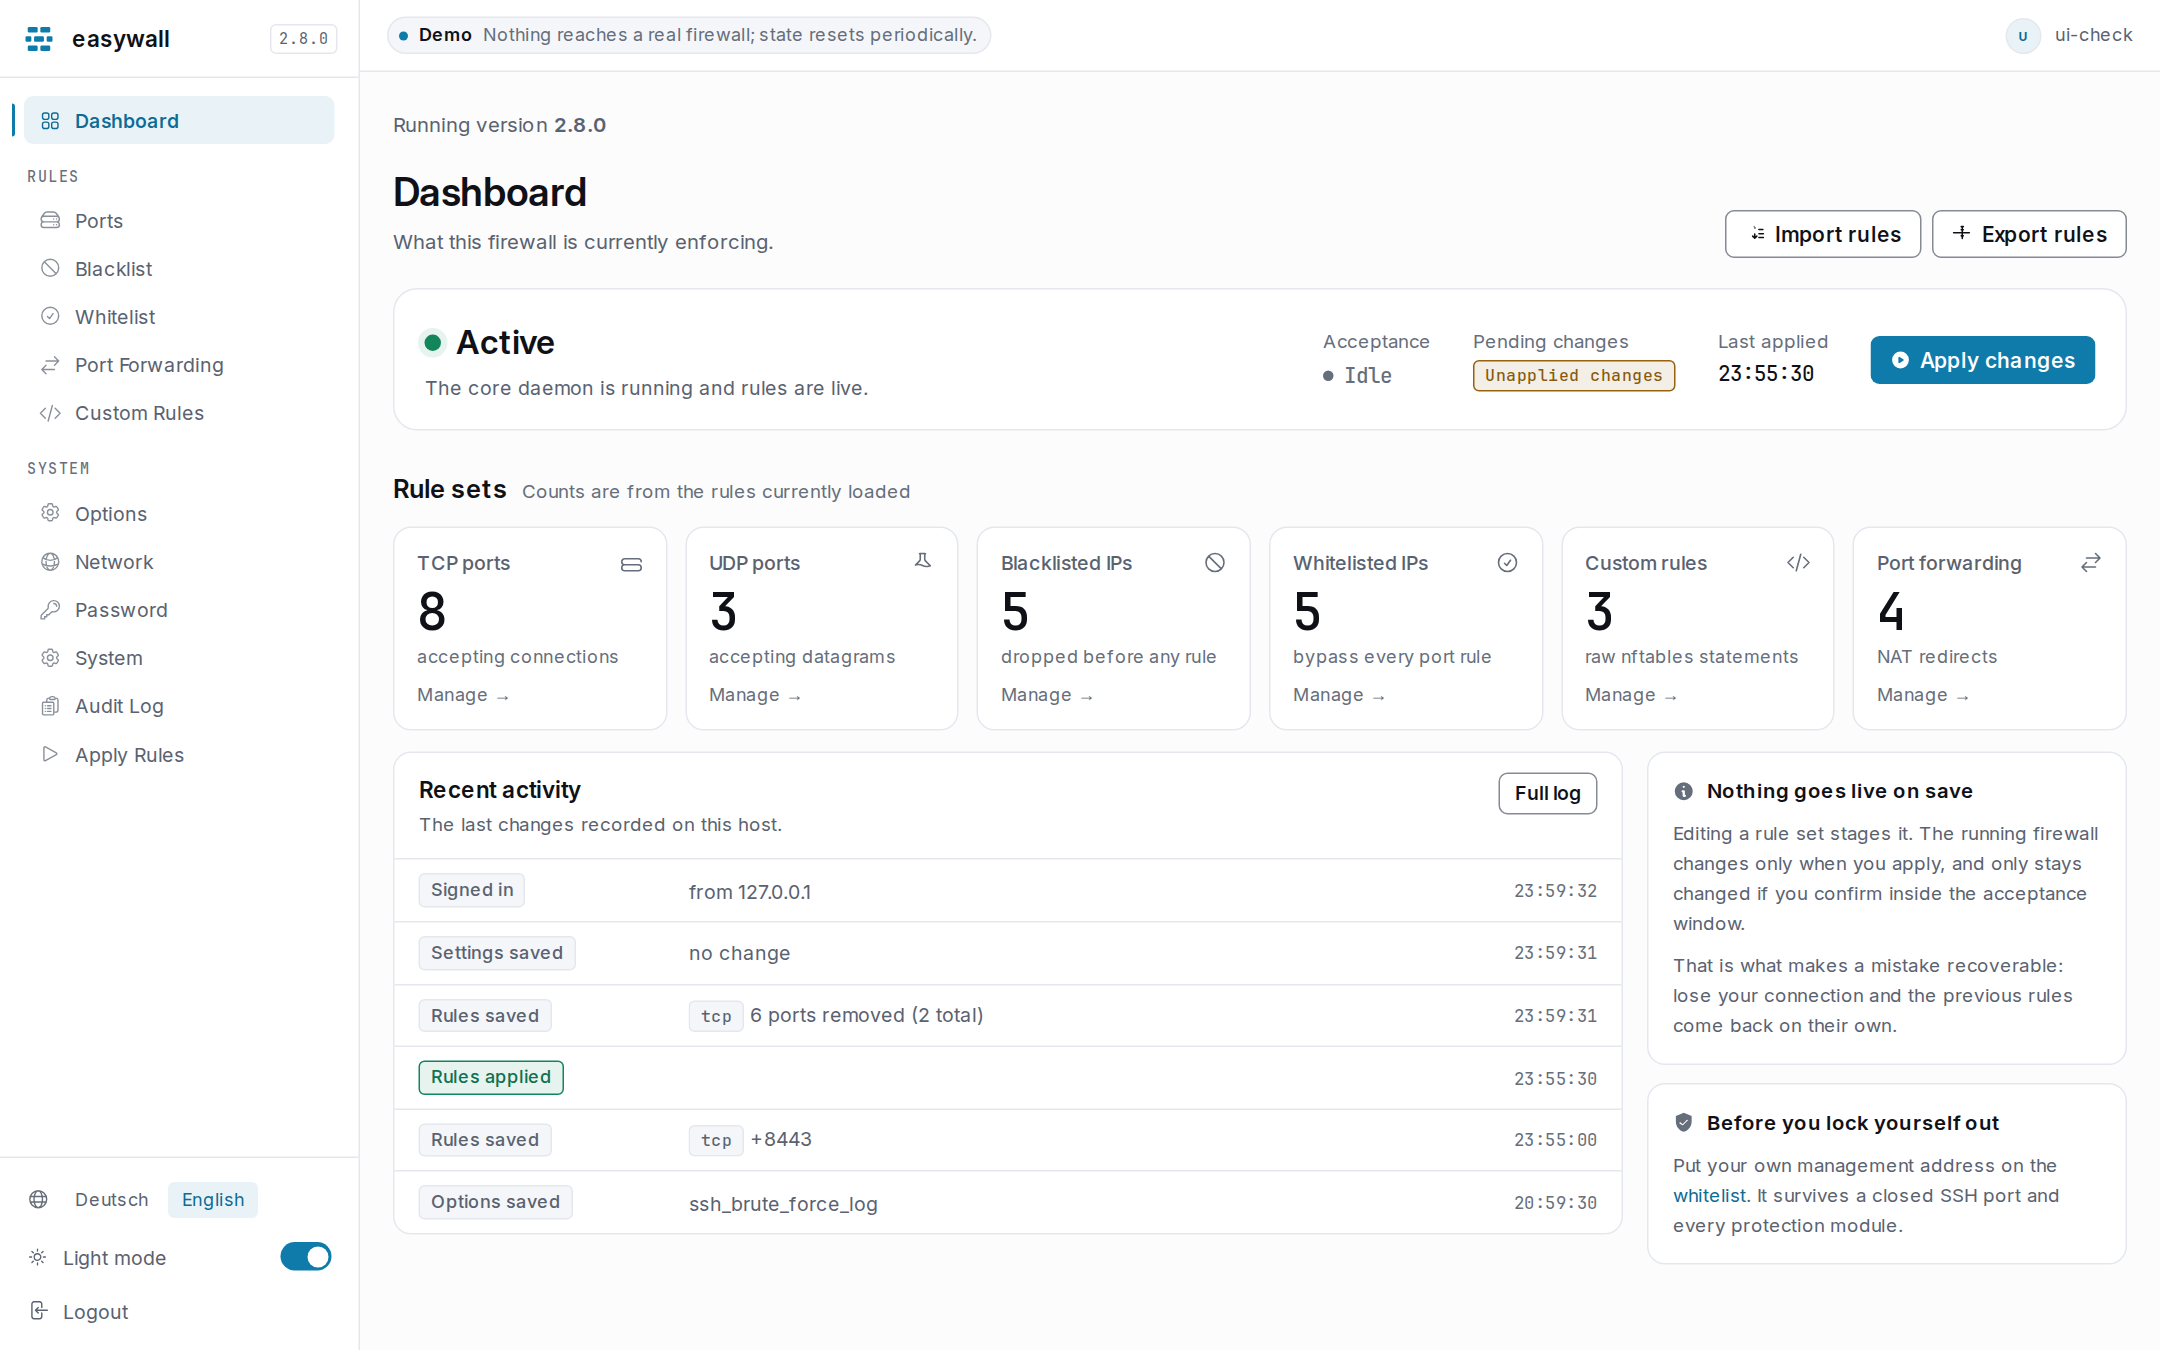
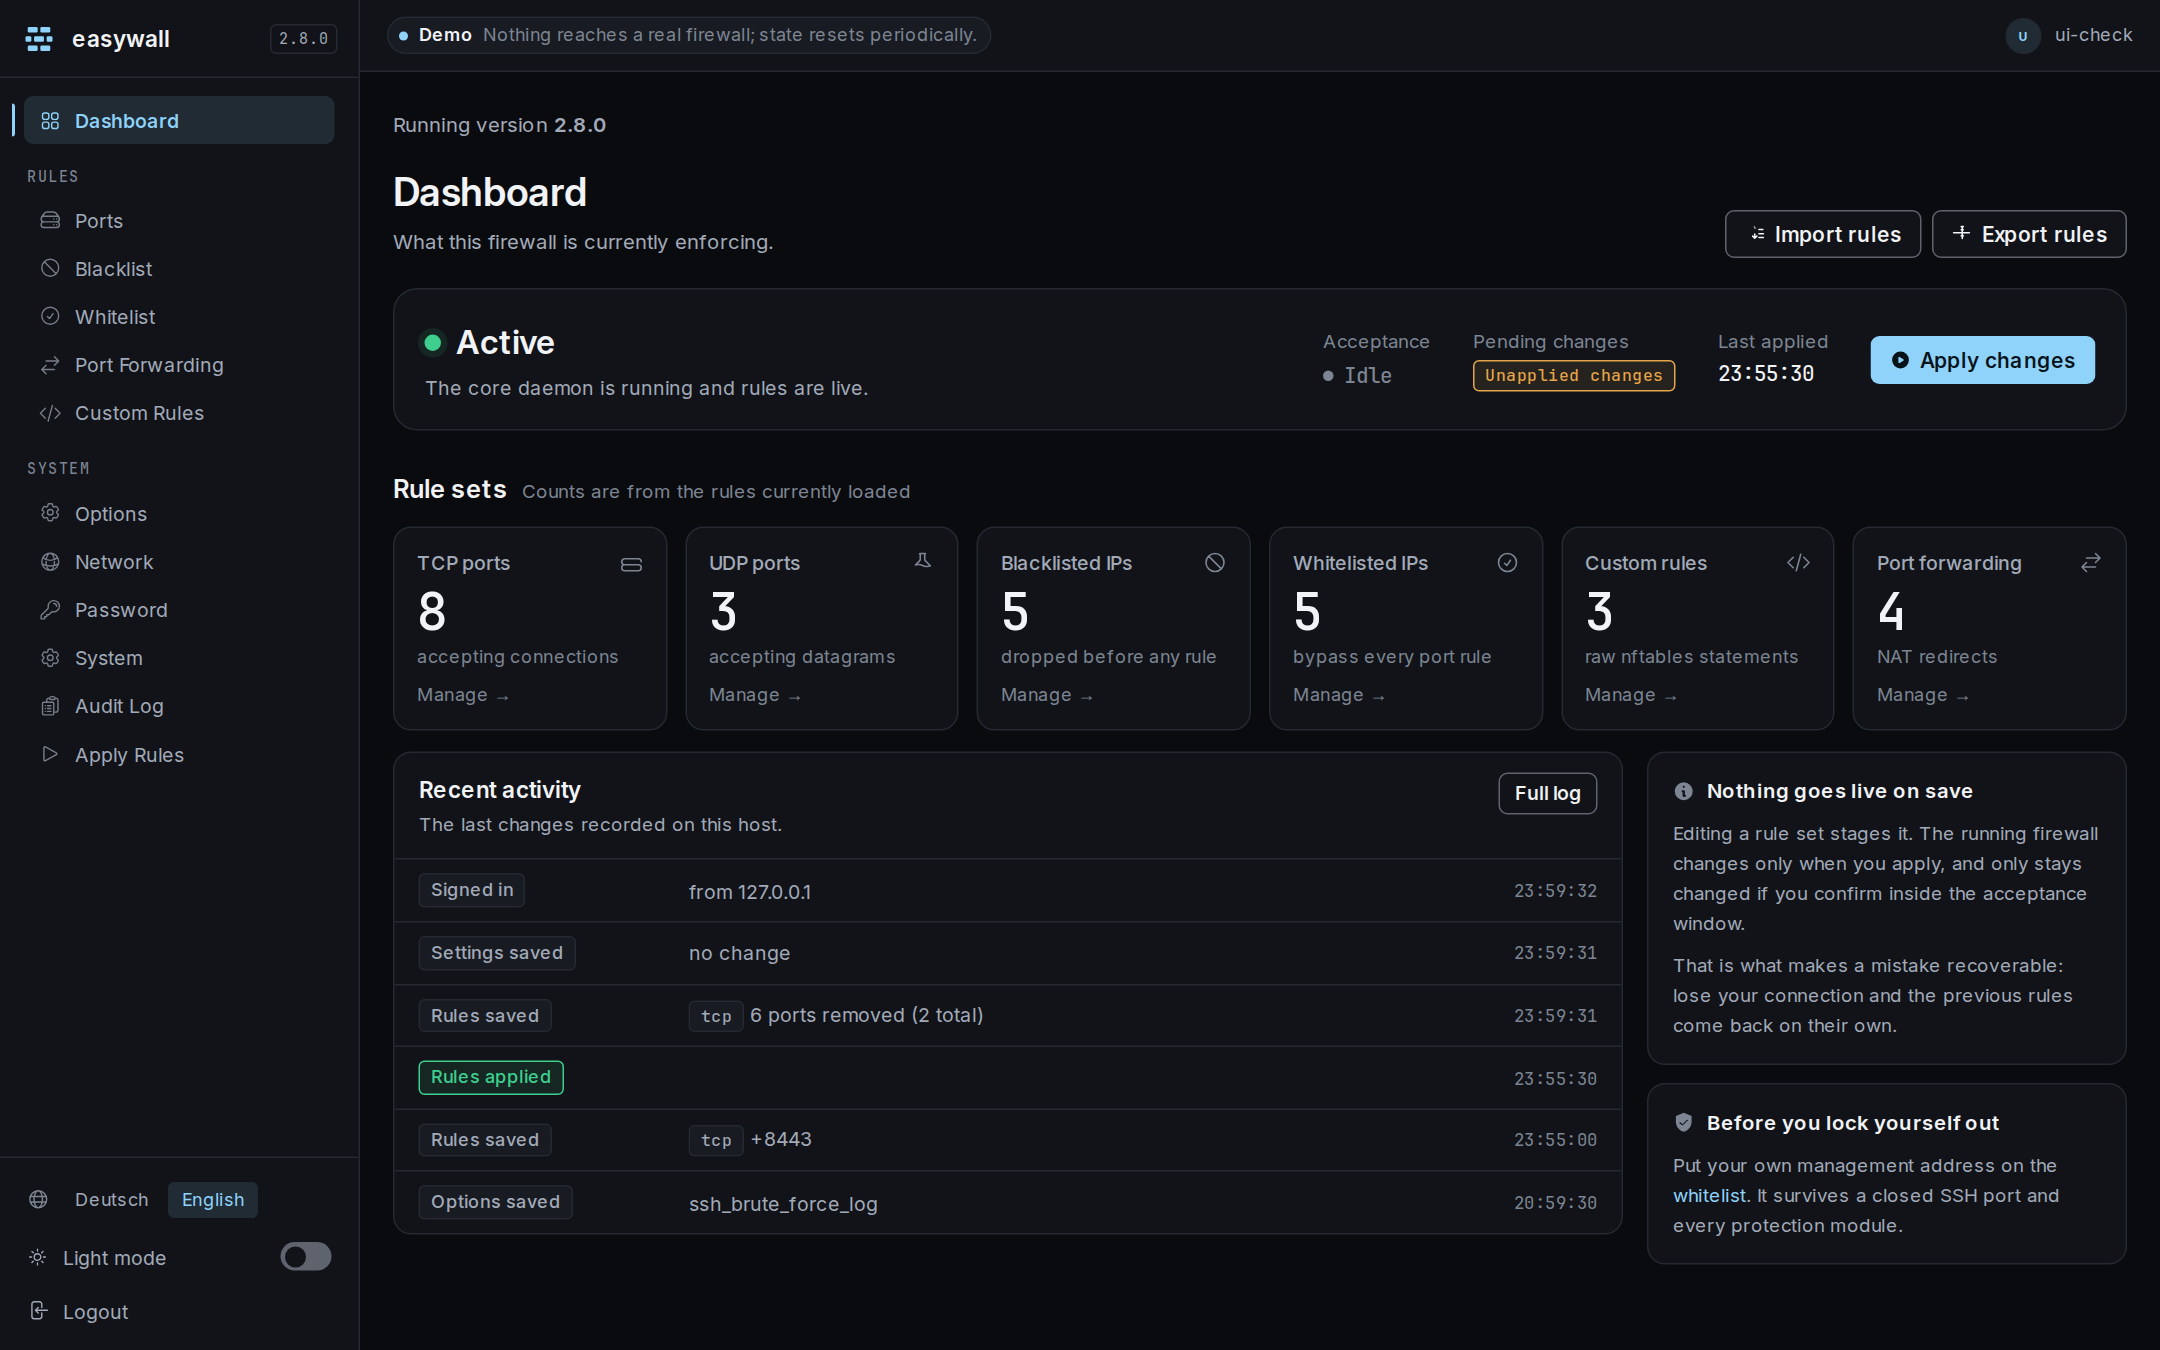
The status card
| Reads | Means |
|---|---|
| Active | the rules are live and the stateful half is matching packets |
| Degraded | still filtering, but something is measurably off |
| Not enforcing | the kernel is not carrying easywall’s rules |
| Pending changes | something is staged that the running firewall does not have — go to Apply |
| Acceptance | whether the window is on, and whether one is open right now |
| Last applied | when the running set was last pushed |
| Self-test | what the four claims about the rule builder last proved on this kernel |
The line under the state is the reason, and it is the useful half: a state with no cause is not something you can act on. Every state and reason is on Health Check, together with the exit codes a monitoring system reads.
“Active” is measured, not inferred from the daemon being up. Until 2.5.0 it reported the daemon’s own opinion, so a table flushed by something else still read as live. Since 2.17 it also reads the kernel’s counters, because for five releases the stateful half matched no packet while every surface said active.
The tiles
Six counts — TCP ports, UDP ports, blocklist, allowlist, custom rules, port forwarding — each linking to its page. They describe the loaded rule set. If you have staged an edit, the tile still shows what is enforced; that is the point of the number.
Recent activity
The last few entries from the audit log, newest first, with a link to the full page. Empty on a fresh installation.
Export and import
Top right. Export downloads the staged rule set as JSON; import replaces it. Neither touches the running firewall — see Export & Import.
The update notice
A banner appears when a newer release exists. The answer comes from a cache on
disk, refreshed in the background once a day, so it never delays the page. On a
host with no route out, the failure is remembered for an hour rather than
retried on every load. update_check = false removes it entirely — see
Configuration.
When it looks wrong
| Symptom | Cause | Check |
|---|---|---|
| “Core daemon unreachable” | easywall-core is not running, or the socket is not reachable by the web user |
systemctl status easywall-core, then ls -l /run/easywall/core.sock — it must be root:easywall |
| Status inactive, rules obviously working | another table is filtering; easywall only reports its own | sudo nft list tables |
| Degraded, with no idea why | the reason line says which of three causes it is | easywall-core health prints the same reason, plus the self-test detail |
| Self-test: Not provable here | normal. Proving anything needs CAP_SYS_ADMIN, which the daemon does not hold |
nothing — see Health Check |
| A count does not match what you edited | the tile shows the loaded set, and your edit is staged | apply it |
| Pending changes you did not make | a save from another browser, or an import | the audit log names it |
| The activity list is empty | nothing recorded yet, or the core cannot write log_dir |
journalctl -u easywall-core |
Next: Applying rules · Audit log · Export & import