 easywall
GitHub ↗
easywall
GitHub ↗
Audit Log
Every administrative change, newest first. The viewer shows the last 200; the file on disk keeps everything.
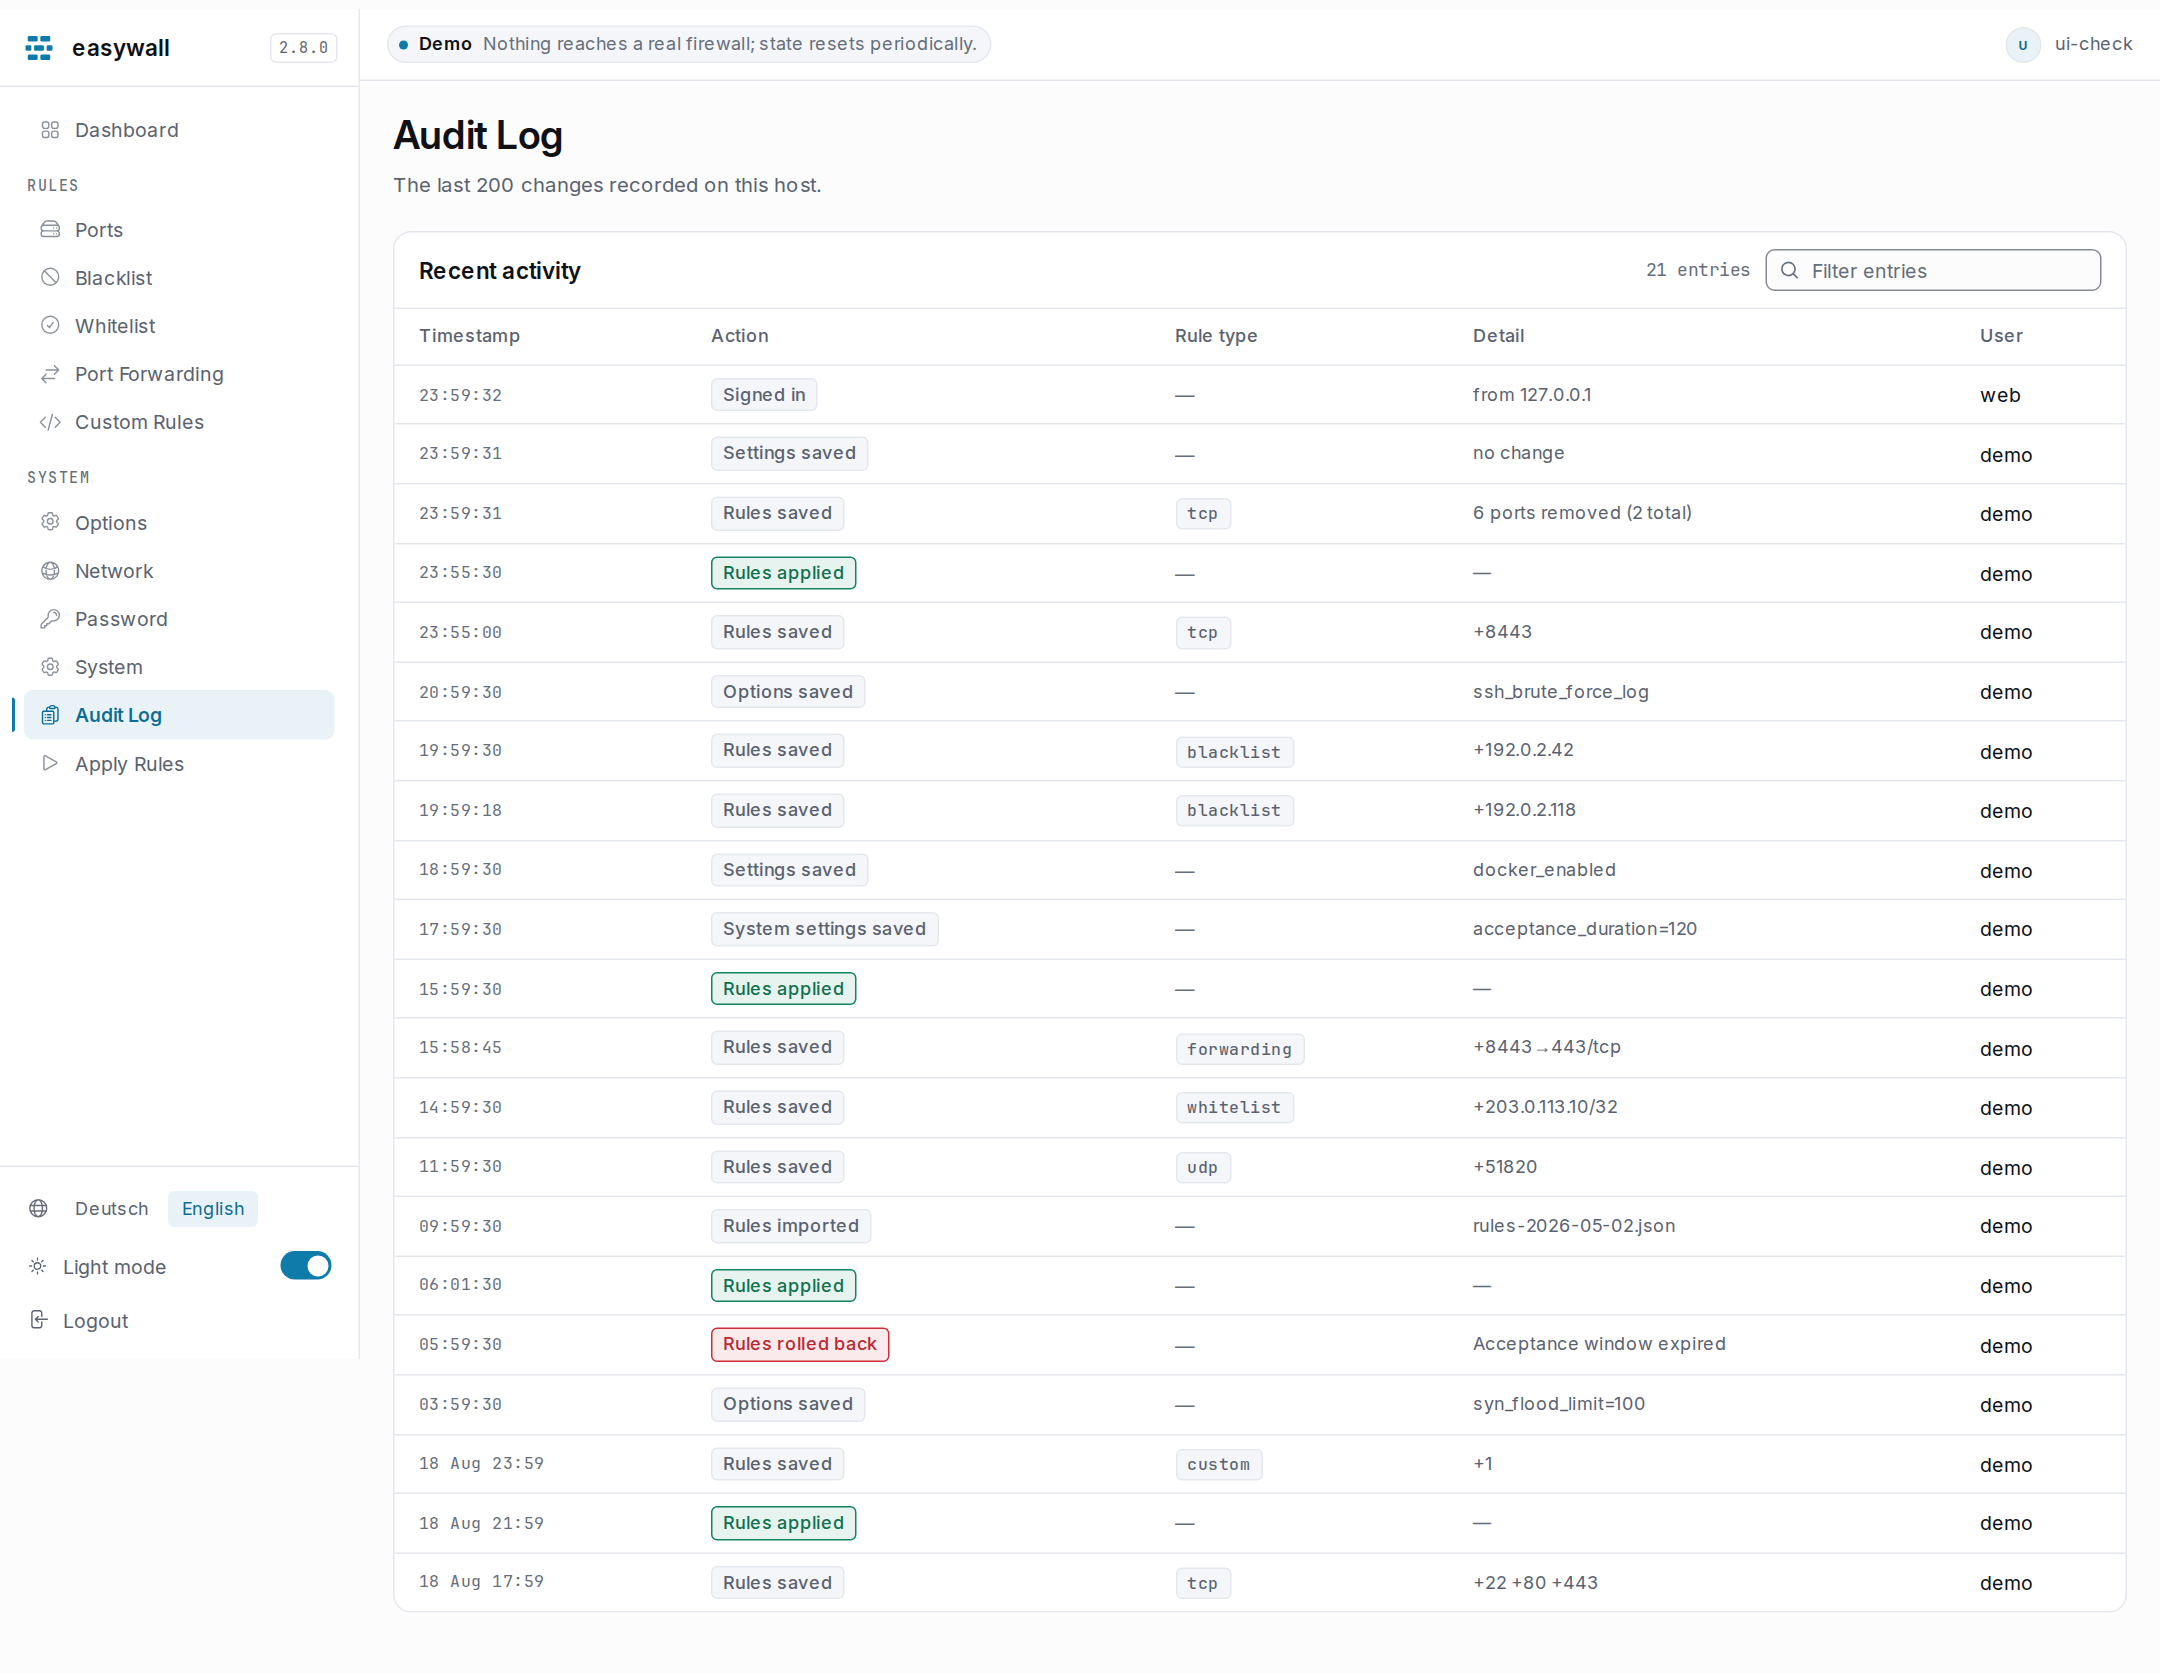
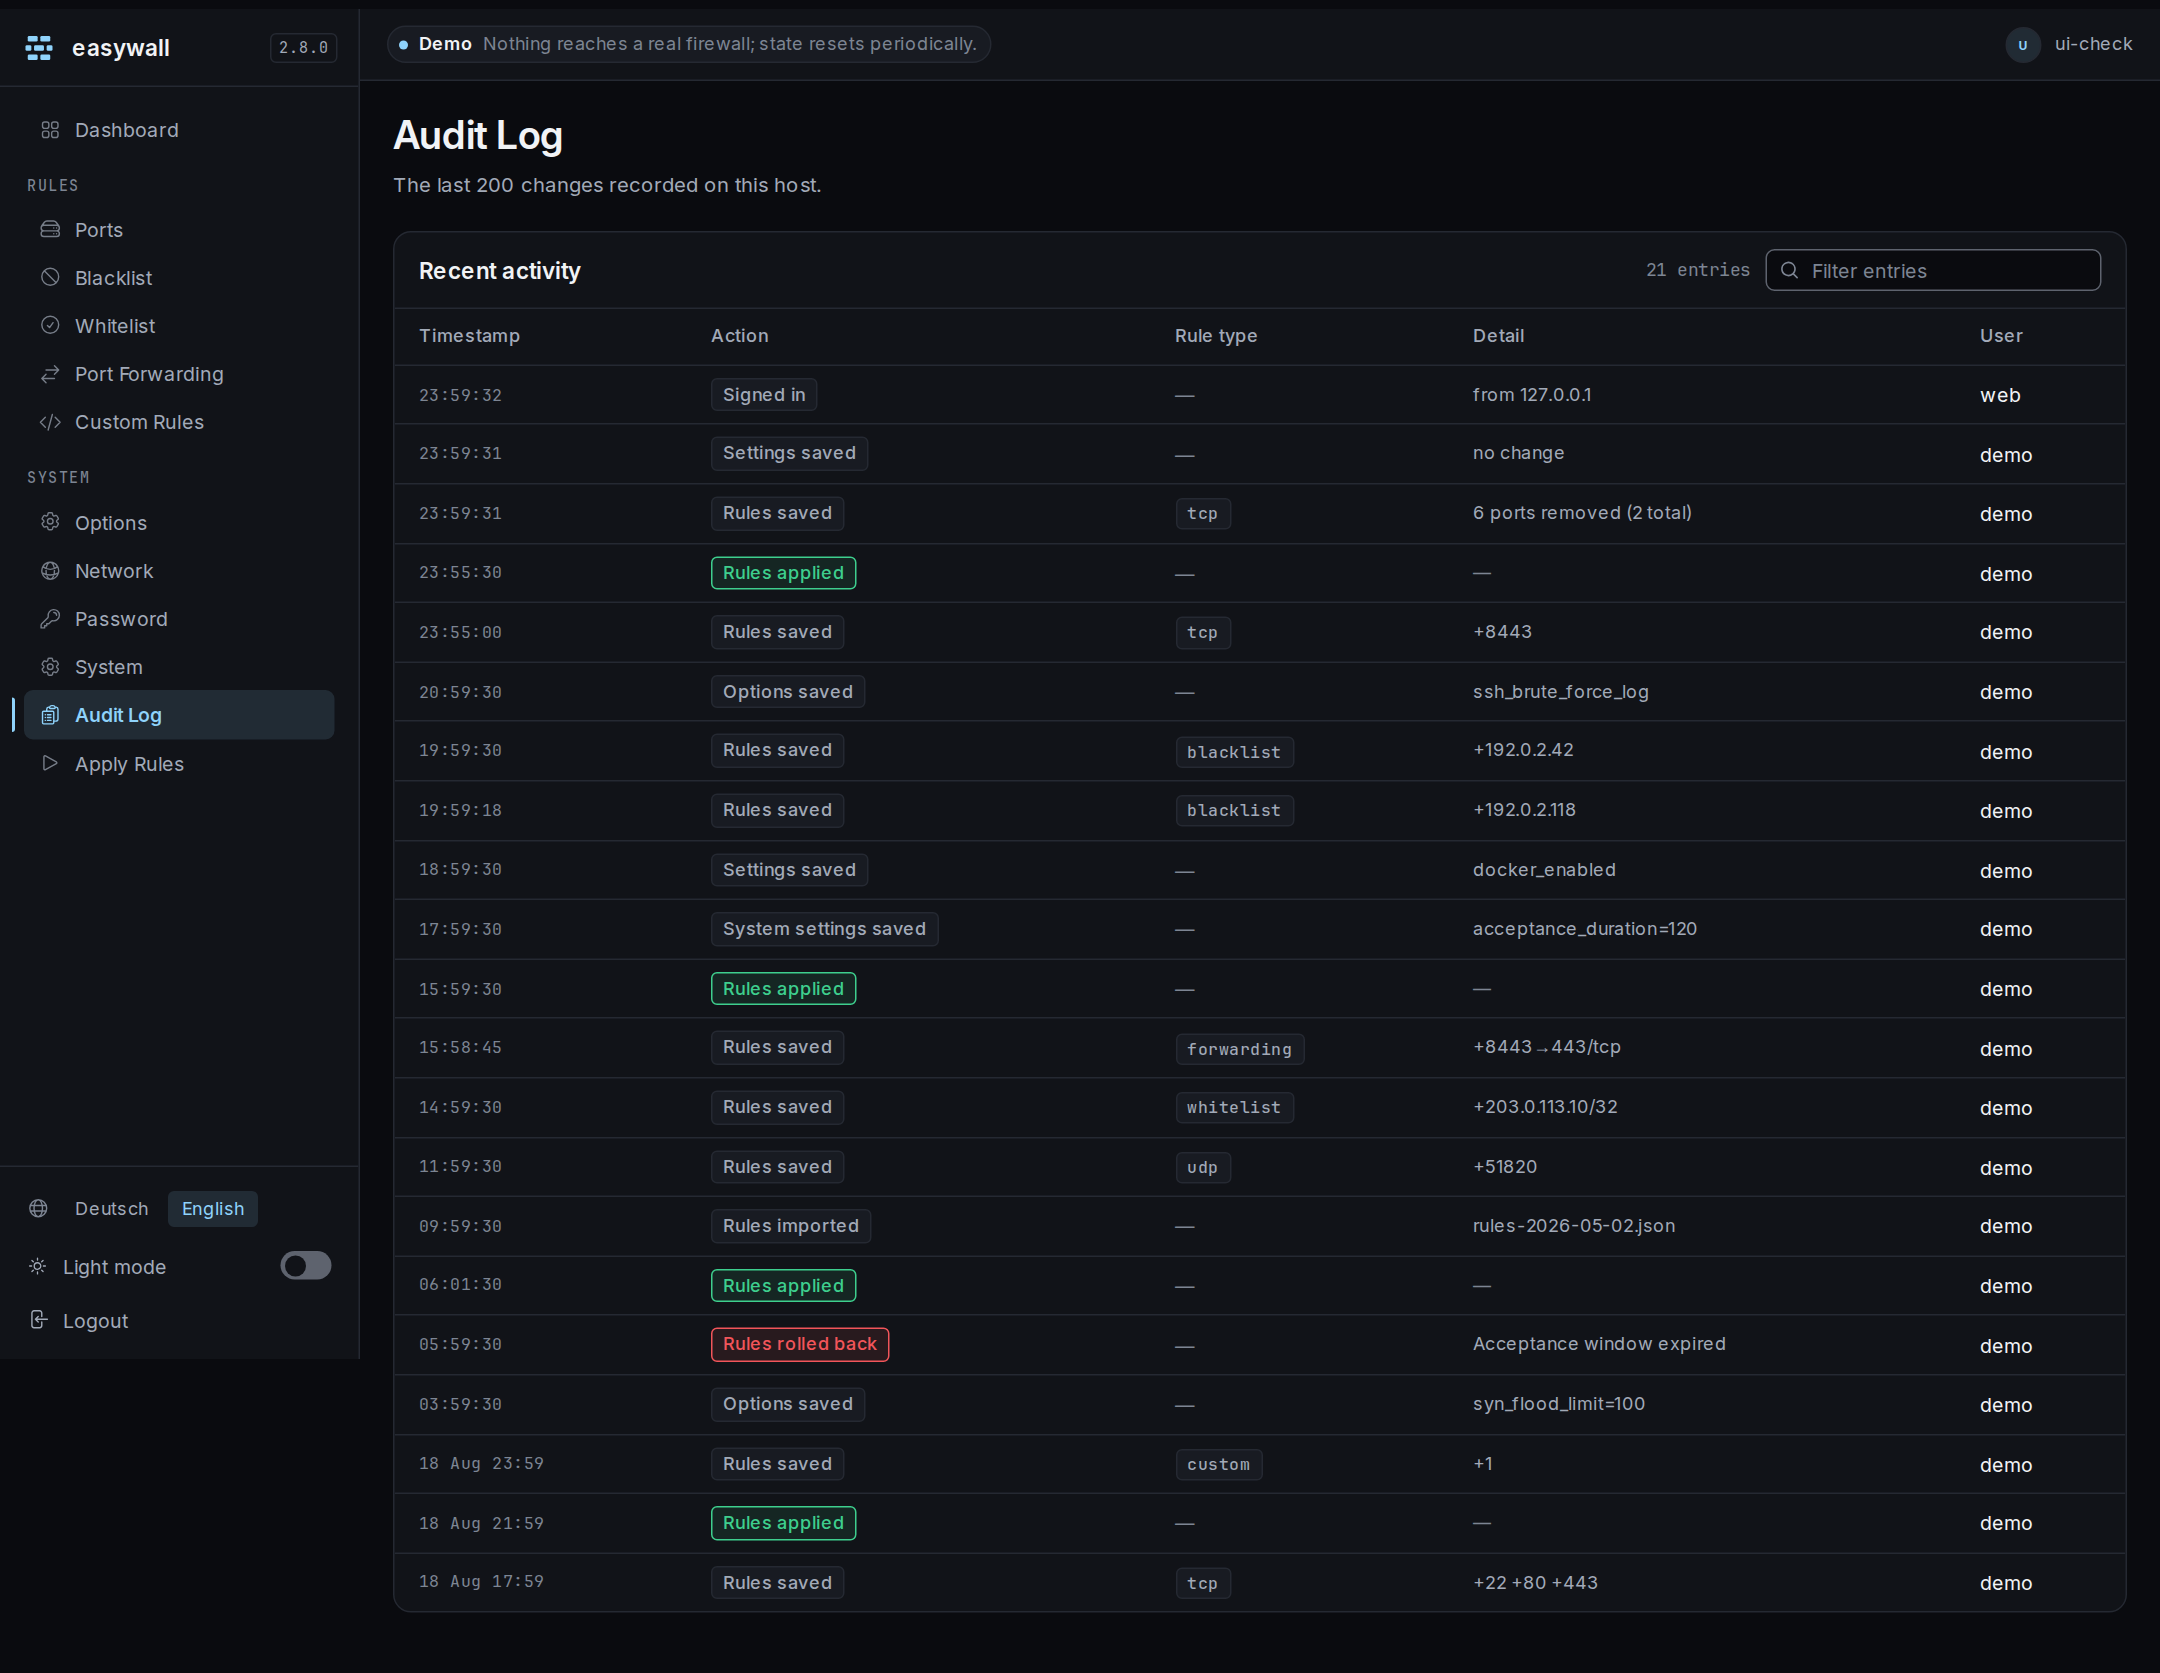
Only 12 entries carry colour
Colour always means firewall state — green live, amber unconfirmed, red rolled back. It is the only thing colour means anywhere in the interface, so a merely informational event is never tinted: a coloured tag would stop meaning anything.
| Action | Reads as | Meaning | |
|---|---|---|---|
| 🟢 | apply_accepted |
Rules applied | Confirmed and live |
| 🟠 | apply_started |
Apply started | Live but unconfirmed — the window is open |
| 🔴 | apply_rolledback |
Rules rolled back | The window closed unconfirmed; the previous rules are back |
| 🔴 | apply_failed |
Apply failed | The rules could not be pushed to the kernel |
| 🔴 | rollback_failed |
Rollback failed | The worst outcome there is: the new rules did not take and the old ones did not come back |
| 🟢 | boot_enforced |
Rules restored at startup | The stored rules were back in the kernel before anything else started |
| 🟠 | boot_not_configured |
Not filtering — nothing configured yet | The daemon started on a host nothing has ever been applied to, and left it as it found it |
| 🔴 | boot_enforce_failed |
Rules could not be restored | The machine came up and is not filtering — nothing on this list is worse. Also written when the panic marker cannot be read at all, when panic mode was engaged from the console while the restore was still writing, and whenever a panic teardown itself failed and the machine may still be filtering behind a marker that says it is not. The detail says which |
| 🔴 | panic_engaged |
Panic mode engaged | A human at the console took the firewall down on purpose. Deliberate does not make it neutral: the machine is unfiltered either way |
| 🟢 | panic_resumed |
Panic mode ended | The console put the firewall back to filtering |
| 🔴 | resume_restore_skipped |
Resume could not restore the rules | Resume cleared the panic marker but an apply held the slot, so the stored rules never made it back — the machine is left exactly as unfiltered as boot_enforce_failed describes |
| 🟠 | health_degraded |
Health degraded | An apply wrote a rule that easywall’s own expression check cannot believe. The table went in anyway, and the rest of the chain is filtering — but one rule may match nothing, which is the class that let the established/related accept enforce nothing for five releases. The detail names the chain and the position; easywall-core health and the dashboard both report degraded until the next clean apply |
| ⚪ | everything else | Rules saved, Options saved, Apply refused — panic mode is engaged, Stored, not written — panic, Feed updated, Feed update refused, … | Something was staged, an attempt changed nothing live, or a feed’s contents were refreshed — the detail names the feed and its entry counts |
rules_savedis neutral, not green. Saving stages a change and leaves the running firewall untouched. The same goes forapply_refused_panicandrollback_skipped. Neither leaves the firewall doing anything new. One is an apply that was refused, or whose rules were taken straight back down when panic mode appeared underneath it. The other is a rollback that left the kernel as the console’s teardown had it, not the reverted rules the label now names. The news in both cases ispanic_engaged, which is red a few lines away. Only the 12 actions above describe what the firewall is actually doing, however consequential an event feels. The count here read 10 against a table of 11 until 2.17 corrected it.
boot_not_configuredis amber because nothing is filtering, not because something went wrong. A new installation ships an empty rule set, and enforcing it would close every port. SSH included — and the interface whose first-run wizard is the only thing that opens them. Filtering starts at your first apply, which has the acceptance window to undo it. The same entry is written when a first apply is not confirmed: the window takes the table back down rather than return you to that empty set.
selftest_passedandselftest_failedare neutral too. The self-test proves easywall’s rule builder against this kernel inside a network namespace of its own. A failed proof is serious and it is not a firewall state: the firewall on this machine goes on filtering exactly as it did a second earlier. Their detail is the one place the proof’s own text is kept./healthzdeliberately carries none of it: the endpoint is unauthenticated, and the text names which claim failed and on which port.
The thirteen login events
New in 2.8, where there were none at all: this page used to send you to
journalctl -u easywall-web for a failed login. 2.18 added the four
passkey_* rows, when a passkey joined TOTP as a way through the second step.
| Action | Reads as | When |
|---|---|---|
login_ok |
Signed in | A completed sign-in, both steps if a factor is enrolled |
login_failed |
Sign-in failed | Wrong username or wrong password |
login_2fa_failed |
Second factor failed | Wrong code, a recovery code that is not one of the eight, or a passkey assertion that did not verify |
login_recovery_used |
Recovery code used | The detail says how many are left |
login_ratelimited |
Sign-in attempts blocked | Five attempts inside ten minutes from one address |
logout |
Signed out | The button, not a timeout |
totp_enabled · totp_disabled |
Second factor switched on / off | From the password page |
recovery_codes_regenerated |
New recovery codes issued | The eight previous ones stopped working at that moment |
passkey_used |
Signed in with a passkey | The second step, completed with a passkey instead of a code |
passkey_enrolled · passkey_removed |
Passkey added / removed | From the password page |
passkey_clone_suspected |
Passkey refused — counter did not advance | Refused as a failed attempt, not signed in |
passkey_clone_suspected means the assertion verified and was refused
anyway. Its signature counter did not move past what that credential last
reported, which is what a cloned authenticator or a replayed response looks
like. The attempt is charged to the same budget a wrong code is.
None of them carries colour, and that is the same rule the table above states: colour means the firewall moved. A sign-in does not move it.
Three of them are folded. login_failed, login_2fa_failed and
login_ratelimited are the three a stranger can trigger. A burst from one
address becomes two lines — the first immediately, then a summary sixty seconds
later saying how many followed. Without that, forty addresses knocking for an
hour would push everything else off the 200 lines this page shows. Beyond 1024
distinct addresses inside one window the rest are counted together, so the volume
is still recorded while the memory is not something a stranger chooses.
The username is never recorded, on a failed sign-in or a successful one. It
would be foreign text in the record, and with exactly one account it says
nothing. The user column says web for all thirteen.
The columns
| Column | Holds |
|---|---|
| Timestamp | Clock time today, day and month before that. The full value is in the title attribute |
| Action | The identifier, rendered in your language |
| Rule type | tcp, udp, blocklist, allowlist, forwarding, custom, or all |
| Detail | What changed — the addresses added and removed, or the settings that moved |
| User | The process that wrote the entry, not the person — one of five values, listed below |
The address is the peer, and says when it is not
easywall records the TCP peer: whoever actually opened the connection — unless
that peer is on trusted_proxies, in which case it records what
X-Forwarded-For names instead. Without an entry there, easywall-web
terminates TLS itself and is not assumed to sit behind a trusted proxy. An
address in the firewall’s own audit log that any client could choose would be
worse than no address at all.
Behind a reverse proxy the peer is the proxy, so every login shows the same
address. When that happens the entry says so: the detail reads the address
followed by a via proxy chip. The line in /var/log/easywall/audit.log
carries the token via-proxy, so grep 'via-proxy' audit.log finds every one
of them.
The user column
It names the process. There were four from 2.7; 2.17’s self-test added the fifth:
| Value | Written by |
|---|---|
web |
the web interface — every rule, option and setting change, and every apply you start from a page |
core |
the daemon itself, for work no operator asked for in the moment: the boot restore and the restore that follows the end of panic mode |
console |
easywall-core panic or resume, carried out by the running daemon on the console’s behalf |
console-no-daemon |
the same two commands with no daemon running, where the console tool writes the marker and the entry itself — the lockout path, so it says which process was there |
selftest |
easywall-core selftest, run by easywall-selftest.service before the daemon exists or by hand at a shell. Neither core nor console is true of it: the proof runs in that binary and the daemon it precedes never sees it |
What is not in it
| Not recorded | Where to look instead |
|---|---|
| Which account made a change | nowhere. web names the process, not the person, because the socket protocol carries no identity yet — roadmap |
| Read-only page views | nowhere — not recorded at all |
Edits made directly to easywall.toml |
your own change management |
The detail column was empty until 2.5.0. Every save wrote a blank, so the column meant to answer what changed was a dash on every line. It now names the addresses that came and went, counts the entries for rule kinds whose members are structures, and names the settings that moved. Long lists are capped at six names plus a count.
On disk
One JSON object per line, append-only, never truncated by easywall:
tail -f /var/log/easywall/audit.log
{"time":"2026-08-09T14:25:41Z","action":"rules_saved","rule_type":"blocklist","detail":"added 203.0.113.7, removed 192.0.2.1","user":"web"}
{"time":"2026-08-09T14:25:43Z","action":"options_saved","rule_type":"","detail":"changed port_scan, tcp_rst_flood","user":"web"}
{"time":"2026-08-09T14:26:02Z","action":"apply_accepted","rule_type":"all","detail":"","user":"web"}
{"time":"2026-08-10T06:14:07Z","action":"boot_enforced","rule_type":"all","detail":"daemon start","user":"core"}
{"time":"2026-08-10T09:02:55Z","action":"panic_engaged","rule_type":"all","detail":"the firewall was taken down from the console","user":"console"}
Each line stores its time as RFC 3339 in UTC. The interface converts it to the
server’s local zone for display. It also keeps the stored value in the
title attribute of the cell, so hovering shows the exact instant the core
recorded.
rollback_failed is the one worth alerting on: it means the new rules did not
take and the previous ones did not come back.
Line-oriented JSON ships straight into Filebeat, Promtail or any log collector.
Rotation is logrotate’s job — the Debian package installs a config for it.
When it looks wrong
| Symptom | Cause |
|---|---|
| The table is empty | Nothing recorded yet, or the core cannot write to log_dir |
| Older entries missing | The viewer caps at 200. The file has them all |
| A search finds nothing you know is in the log | The filter searches the same newest 200, not the file. grep the file for anything older |
| Wrong timezone | Timestamps are stored in UTC and shown in the server’s local zone. If the interface disagrees with your clock, it is the server’s zone that is off — timedatectl set-timezone Europe/Berlin, then restart easywall-web. In Docker, set TZ on the container |
| A filter finds nothing | It matches action, rule type, detail and user; not the timestamp — and only within the 200 entries the page was given |