 easywall
GitHub ↗
easywall
GitHub ↗
Blocked traffic
The page shows every packet a log switch refused, newest first, and lets you allowlist, blocklist or open a port from the row that refused it.
Turn logging on
Every switch is off by default — nothing appears here until at least one is on. Open Options → Logging and switch one on. The two worth starting with:
| Switch | Logs |
|---|---|
log_blocked_connections |
Everything the final policy drops — the broadest one |
ssh_brute_force_log |
Connections over the SSH rate — the one most hosts get hit with first |
Read a row
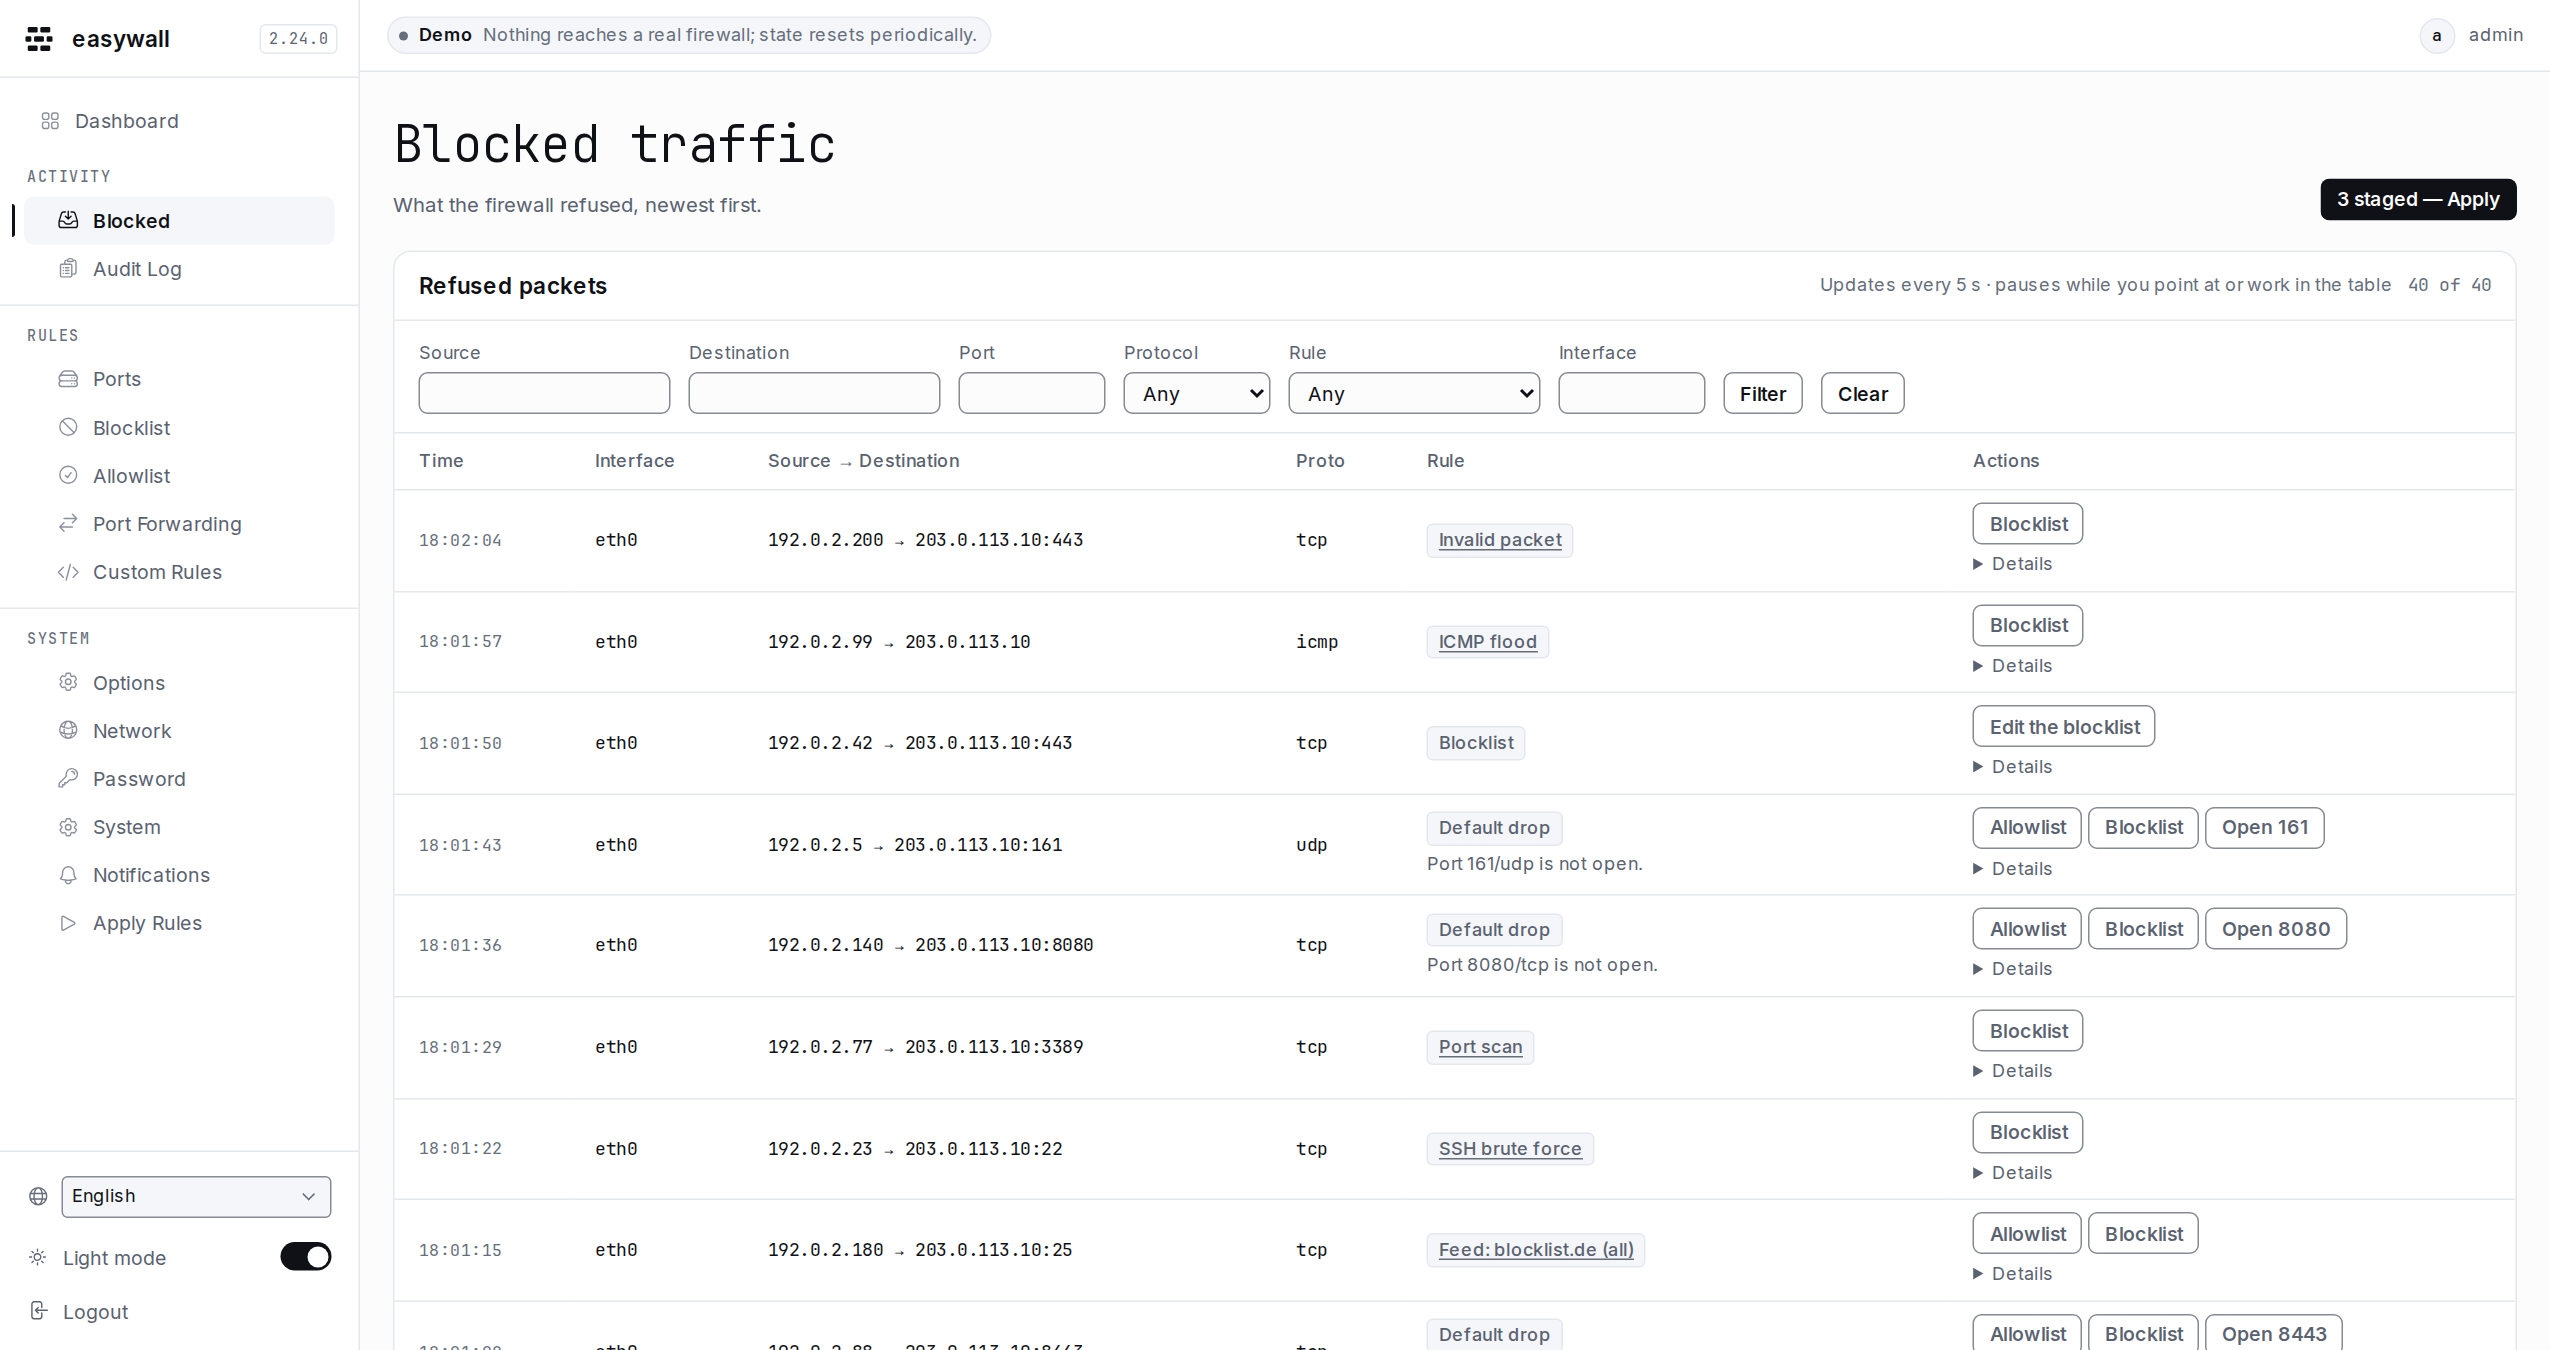
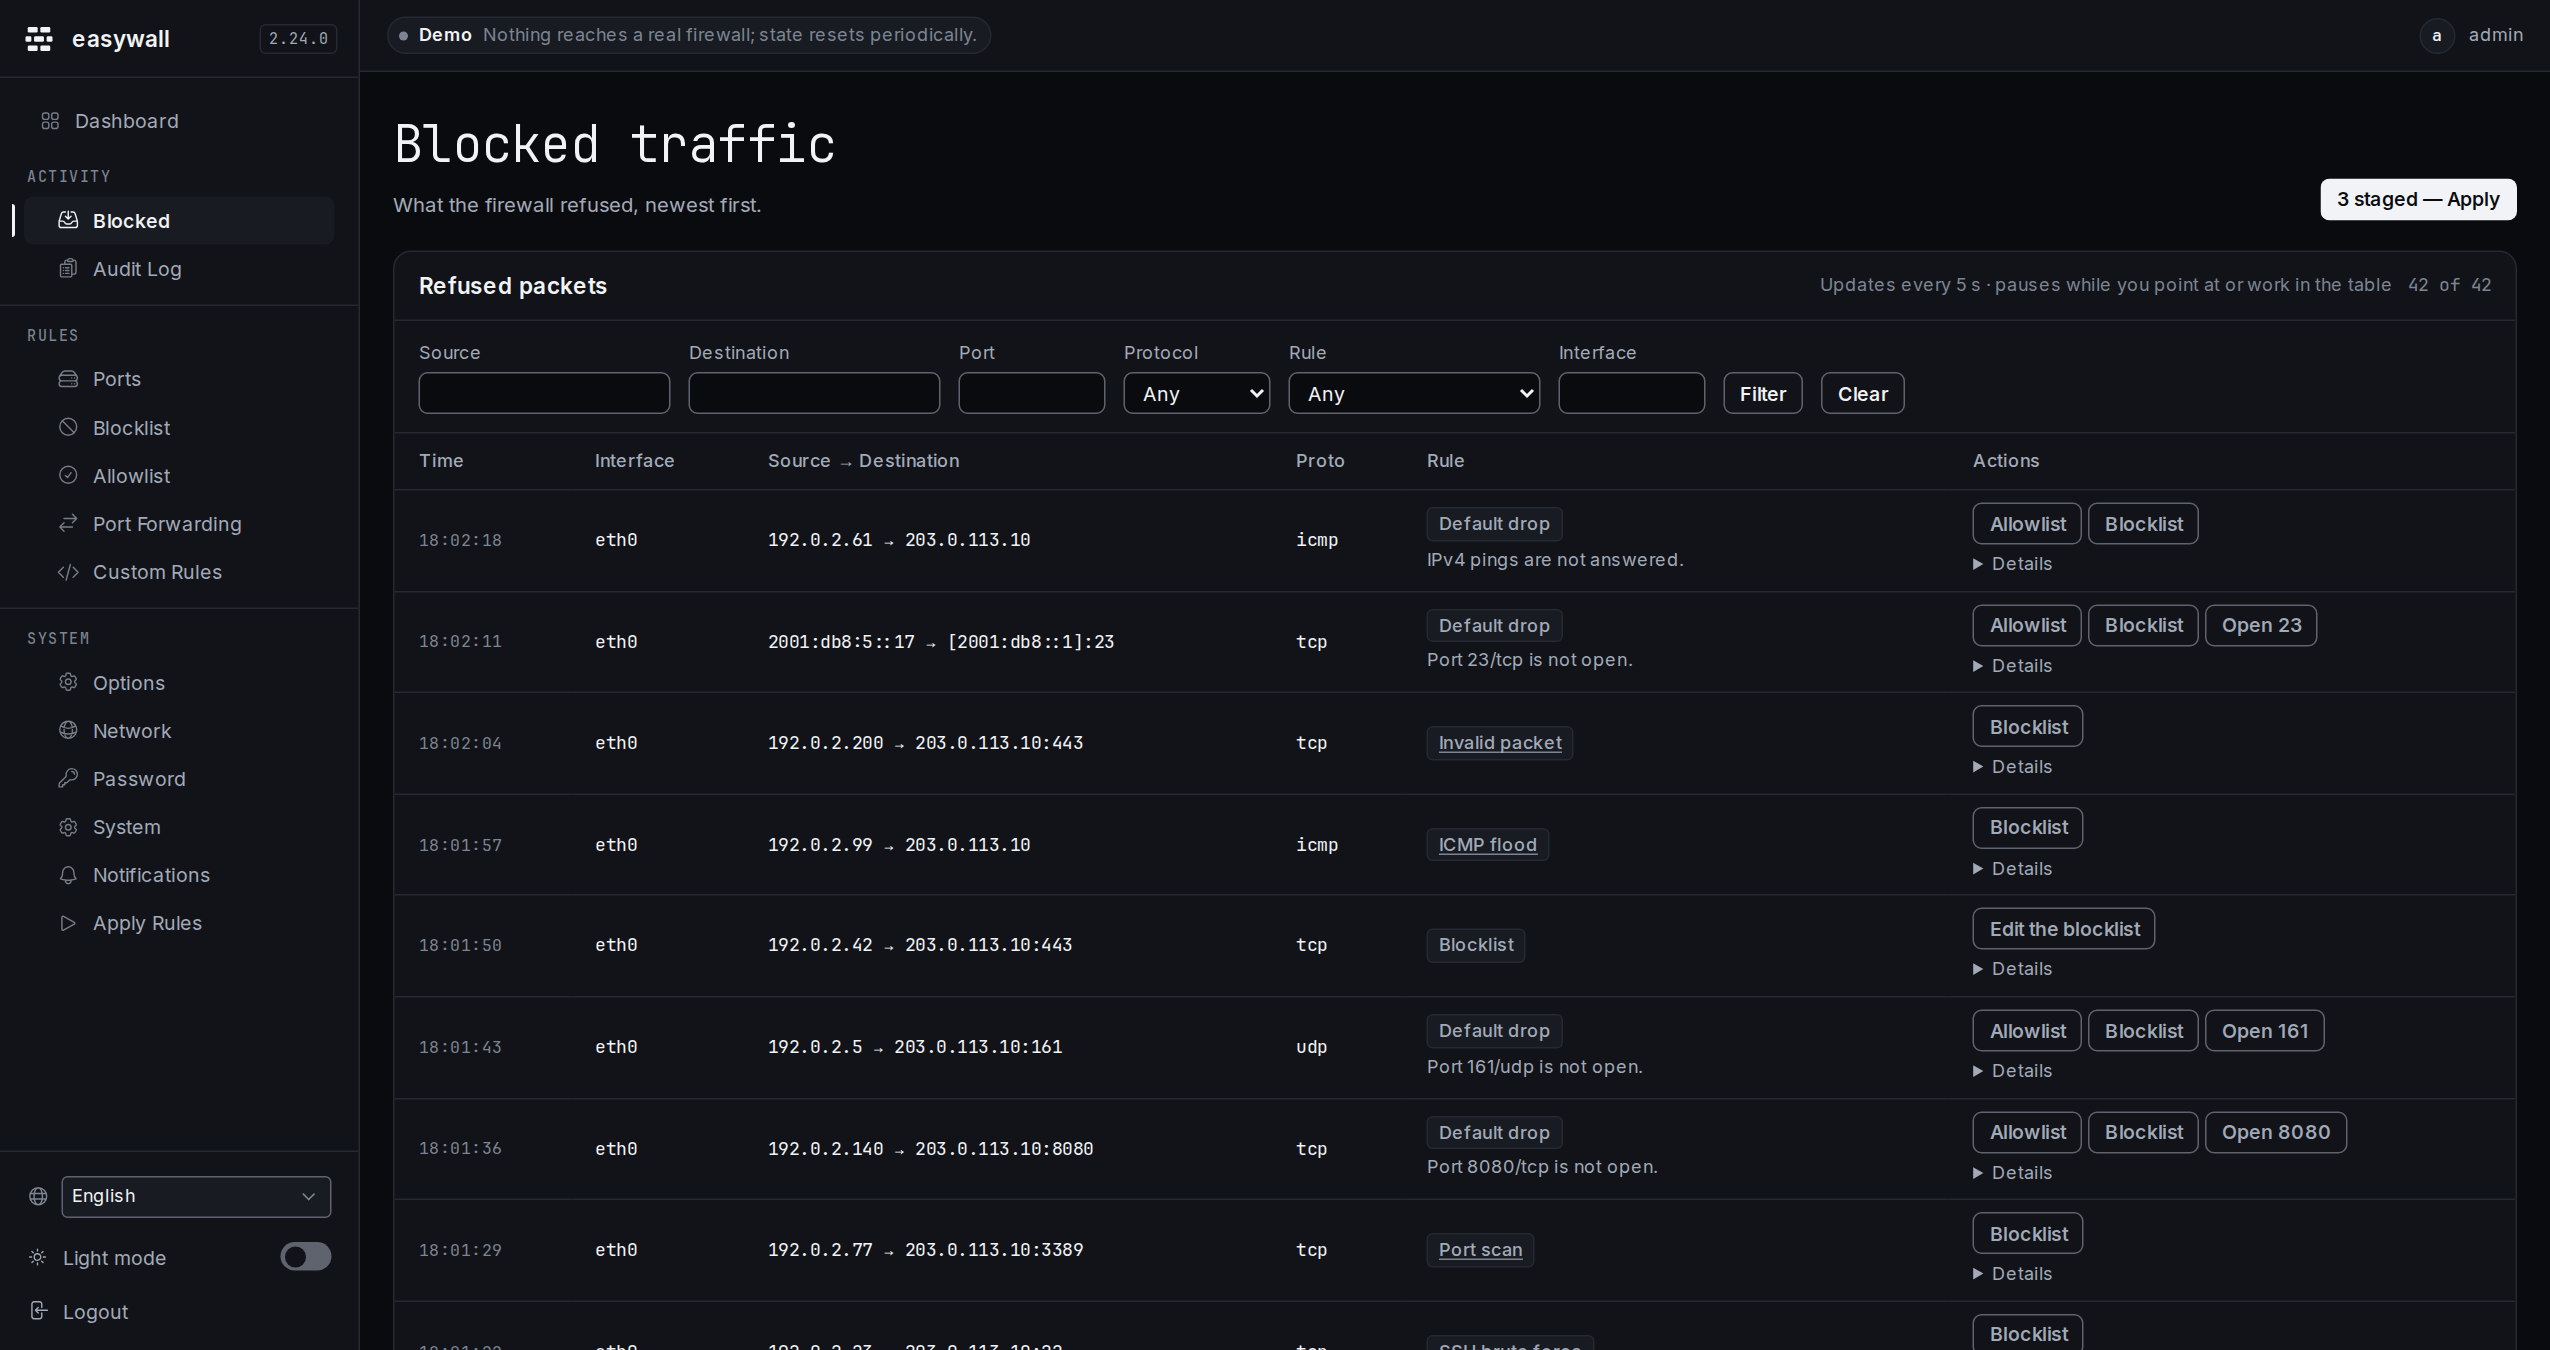
| Column | Shows |
|---|---|
| Time | When the packet arrived, local time — to the second today, without seconds beyond that; hover for the exact instant |
| Interface | The device it arrived on |
| Source → Destination | Address, and the destination port if there is one |
| Proto | tcp, udp, icmp, icmpv6, or a bare protocol number |
| Rule | Which of the eleven switches refused it, or Another rule. A module’s name links to its switch on Options; a Default drop says why underneath |
Details opens the rest: exact time, TCP flags, ICMP type and code, connection state, TTL, source port, chain and packet mark — whichever of these the packet carried.
Why a default drop refused it
Default drop means no switch refused the packet — nothing let it in. The line under it names what was missing, read from the rules applied now:
| The line reads | Because |
|---|---|
| Port 993/tcp is not open. | no port rule covers it |
| 993/tcp is open only for 10.0.0.0/8. | a rule covers it, for other sources |
| … open only for traffic forwarded to a container | the rule’s scope is forwarded |
| IPv4 pings are not answered. | echo request is not on the always-on list |
| ICMP type 13 is not accepted. | nor is any other type off that list |
| … now — this arrived before it was. | the rules changed since: the port, the allowlist, the blocklist, an ICMP type or the IPv6 mode |
No line appears while the applied rules cannot be read.
Narrow it down
Six filters sit above the table — source, destination, port, protocol, rule, interface — and clicking an address, a port or an interface in a row filters to it directly. The filter is the URL’s query string, so the view is exactly what you bookmark or paste into a message to someone else.
Act on a row
Three actions per row, only where they make sense — Open needs a destination port and a protocol the firewall can open:
| Action | Does |
|---|---|
| Allowlist | Stages the source address on the allowlist |
| Blocklist | Stages the source address on the blocklist |
| Open port | Stages a port rule for the packet’s destination port and protocol |
| The packet was refused by | Offered | Why not the others |
|---|---|---|
| Default drop | allowlist · blocklist · open the port | — |
| Bogon filter | allowlist · blocklist | a port rule runs after the filter |
| Another rule (your custom rules) | allowlist · blocklist | opening the port would override a rule you wrote |
| The blocklist | a link to the blocklist | the blocklist is checked before the allowlist |
| A protection module (SSH, SYN, ICMP, RST, port scan, invalid, fragment) | blocklist | modules run before the allowlist and the ports |
The table pauses while you point at it or work in it, and catches up when you leave.
They stage. They never apply. A staged count appears beside the page title and links to Apply; nothing reaches the kernel, and no acceptance window starts, until you go there.
It will not let you lock yourself out. Blocklisting the address you are signed in from — or, behind a reverse proxy, the proxy’s address — is refused with the reason, before anything is staged. The same check the apply screen runs.
When the page is empty
| State | Reads |
|---|---|
| The core could not be read | Core daemon unreachable: and the error |
| Nothing switched on | Nothing is being logged — with a link to the switches |
| On, nothing refused since time | Nothing has been refused since … |
| Not running, never bound | a banner naming the NFLOG group and why the bind failed; logged packets go to the kernel log instead |
| Not running, stopped after running | a banner saying so; nothing is logged anywhere — not here, not the kernel log — until easywall-core restarts |
What it does not show
Accepted traffic, bytes per session, geolocation and reverse DNS. It is a list of packets the firewall refused, decoded from what NFLOG hands the core — nothing this page shows was looked up anywhere else.